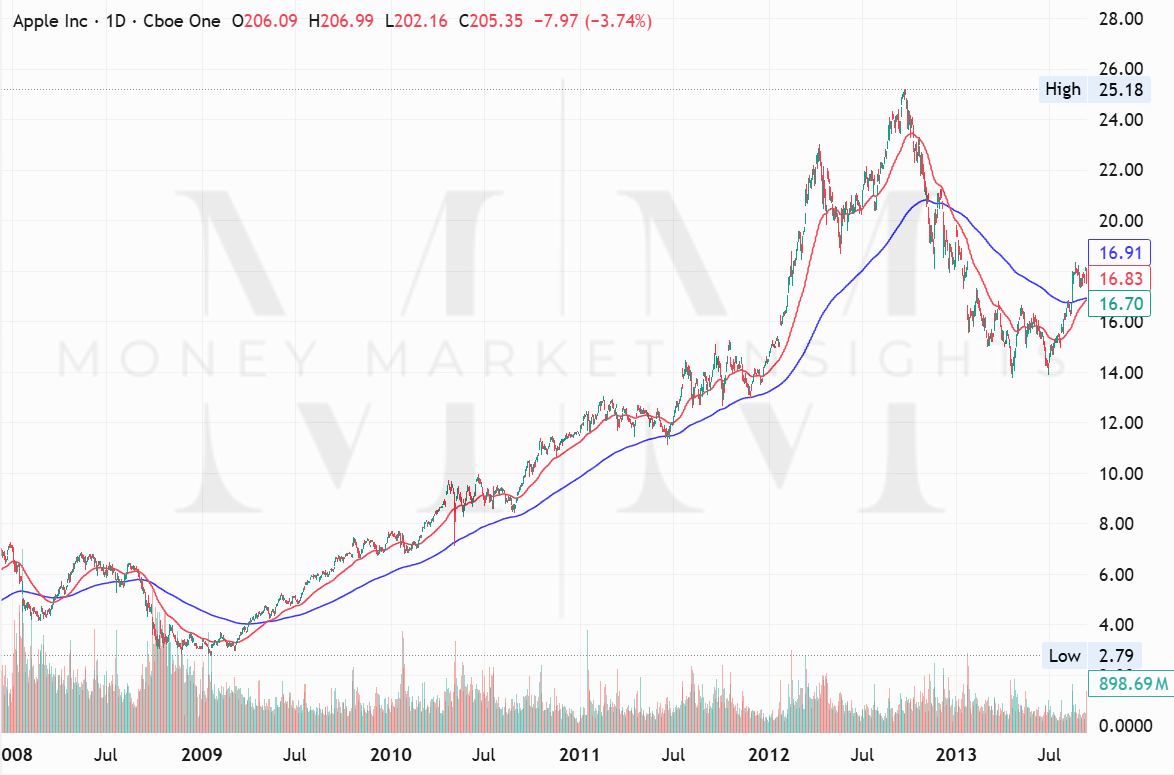
How to Swing Trade with Moving Average Crossovers
Swing trading strikes a balance between the speed of day trading and the patience of long-term investing. It gives traders the opportunity to capture meaningful price moves over several days or weeks without being stuck in front of a screen all day.
One of the most time-tested strategies for swing traders is the Moving Average Crossover. It’s straightforward, effective, and widely used by both retail and professional traders. At its core, the strategy identifies momentum shifts by comparing short-term and long-term price averages.
In this article, you’ll learn how the strategy works, why it’s effective, and how to apply it with clear entry and exit rules.
What Is a Moving Average Crossover?
A moving average calculates the average price of a stock over a specific time period. Traders often use two moving averages:
A short-term moving average, such as the 50-day exponential moving average (EMA), which tracks price more closely
A long-term moving average, such as the 200-day EMA, which reacts more slowly and smooths out broader trends
A crossover happens when the short-term moving average crosses above or below the long-term one. This signals a shift in market sentiment:
A bullish signal occurs when the short-term crosses above the long-term (often called a Golden Cross)
A bearish signal occurs when the short-term crosses below the long-term (often called a Death Cross)
This pattern is used to spot potential turning points and trend confirmations.
Why It Works
Markets often trend because of collective investor behavior. A crossover represents a shift in short-term momentum that is strong enough to override the longer-term average. This suggests a change in market sentiment and potential trend direction.
The strategy is popular because it provides:
Objective entries and exits
Confirmation of trend direction
A way to reduce emotional decision-making
Professionals often use this setup in combination with volume and broader market context to improve accuracy.
Step-by-Step
Screen for Candidates
Start by filtering for stocks with healthy trends or emerging breakouts. Look for stocks with strong relative strength, recent catalysts, or clean technical setups. Use tools like Finviz or TradingView to screen for price performance, volume, and momentum.
Plot the Moving Averages
On your chart, add a 50-day EMA and a 200-day EMA. These lines will help you visually identify the crossover and trend structure.
Wait for the Crossover
A buy signal is triggered when the 50-day EMA crosses above the 200-day EMA and the price closes above both moving averages. Ideally, the crossover occurs after a period of consolidation or a pullback.
Confirm with Volume
Make sure the breakout is supported by strong volume. This increases the likelihood of follow-through. A volume spike often confirms institutional interest.
Define Your Entry, Stop, and Target
Entry: After a daily close above the crossover
Stop-loss: Below the 50-day EMA or the most recent swing low
Target: Use a 2-to-1 reward-to-risk ratio or trail your stop with the 20-day EMA
Meta Platforms (META 0.00%↑)
In 2023, META showed a 50-day EMA crossing above its 200-day EMA. Volume spiked as the price broke above both moving averages.
Entry was around $180 after confirmation
Stop-loss was placed at $150
Price moved quickly to $250 over the next few weeks
This setup provided a clean move in a relatively short time, with defined risk and strong confirmation.
Major firms like Goldman Sachs and BlackRock still incorporate moving average crossovers into larger models. This simple strategy has marked several key turning points in history:
The 2012 and 2016 Golden Crosses in the S&P 500 (SPY 0.00%↑) preceded multi-year bull markets
Apple’s (AAPL 0.00%↑) 2009 crossover came just before its post-iPhone growth surge
It may seem basic, but it's grounded in sound technical logic and institutional behavior.
What to Avoid
Range-bound markets: Avoid using this strategy when the stock is moving sideways. Crossovers in a choppy market often lead to whipsaws.
Chasing price: Don’t enter after a large breakout candle. Wait for confirmation or a small pullback.
Forcing trades: Not every crossover is tradable. Focus on quality setups with strong confirmation.
The Moving Average Crossover strategy offers a clear, structured way to catch swing trades with high potential. It works best when paired with volume analysis and basic trend filters. If you’re looking to build confidence in your swing trading approach, this setup is an excellent place to start.
*Disclaimer: Not Financial Advice. Investors should conduct thorough research and seek professional advice before making any investment decisions.


